Monitoring
The Monitoring Tab provides a customizable dashboard for monitoring and controlling robots. Users can create, save, and load dashboard presets tailored to their specific needs. The dashboard starts with a single view by default, but additional views can be added using the Add Viewer button. The 3-dot menu allows splitting views vertically or horizontally, enabling flexible layout customization
To manage presets:
- Name a new preset by clicking the pencil icon.
- Load an existing preset from the dropdown menu on the left.
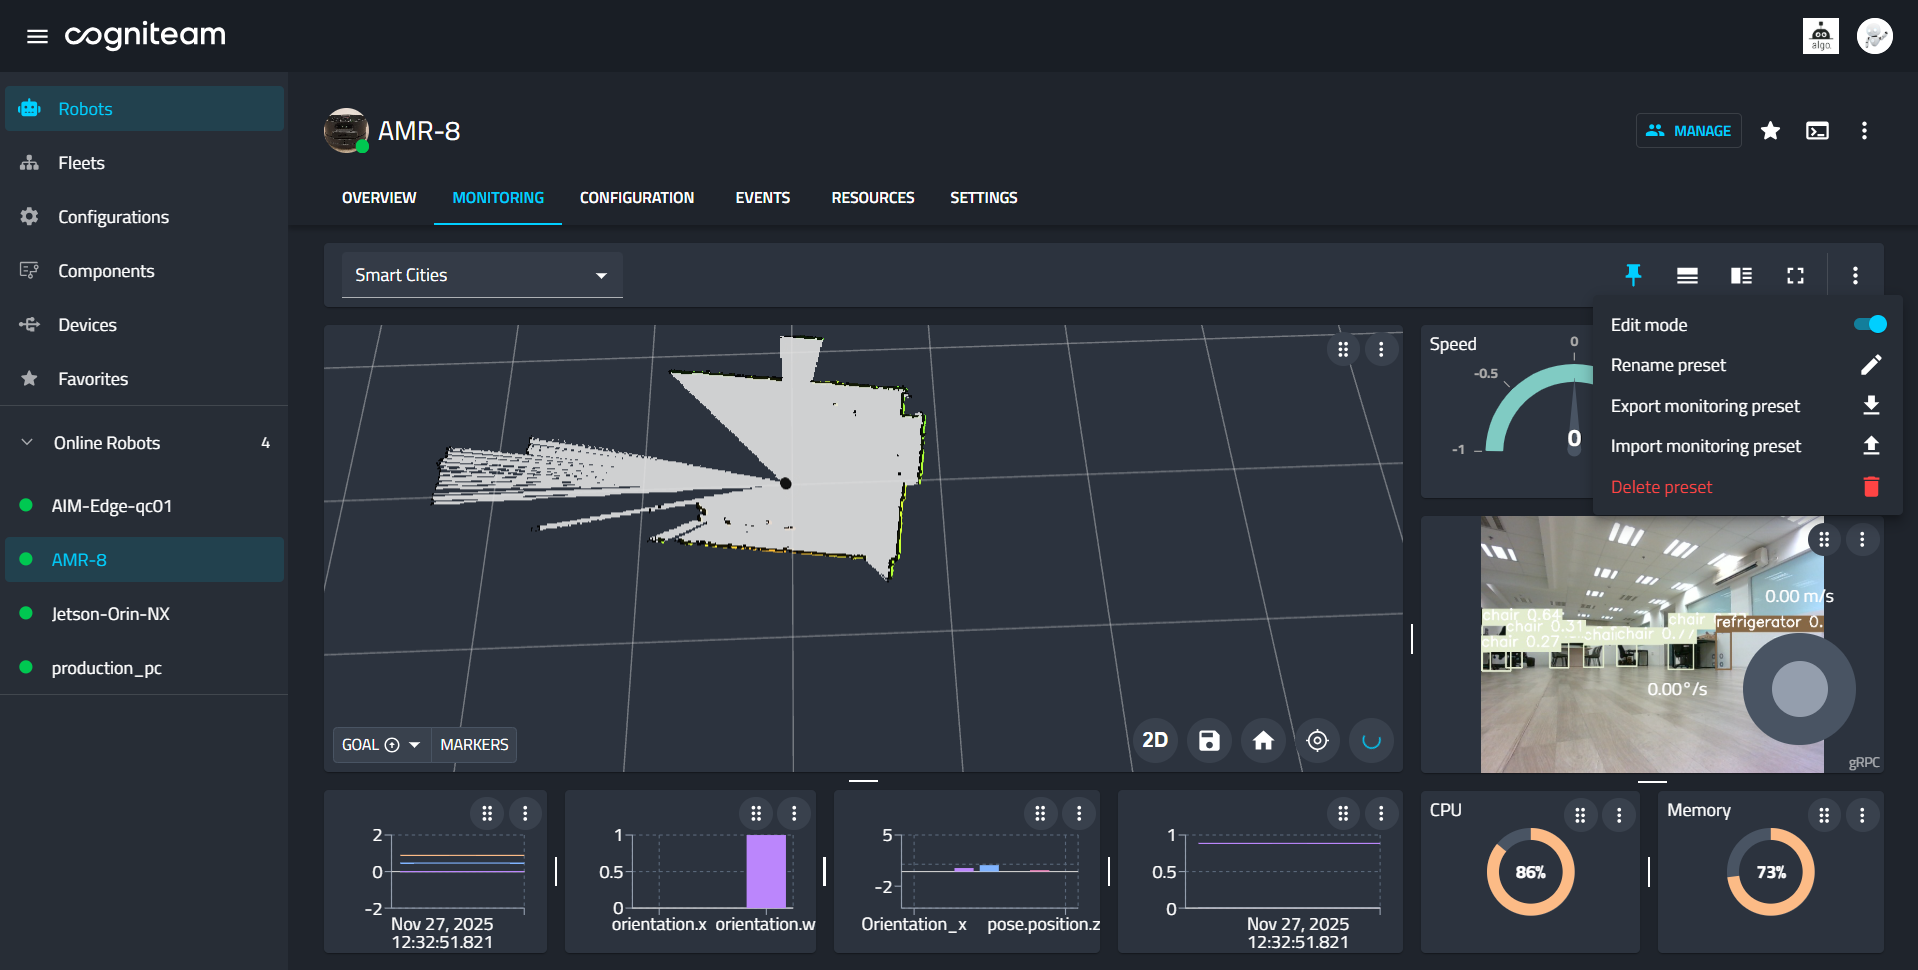
Adding a Viewer
Clicking Add Viewer opens a popup where users select a viewer type and the robot streams to display. Each tile in the popup represents a viewer type. Selecting a tile updates the table below with available streams, such as ROS1/2 topics from the robot or streams from dockerized components installed via Cogniteam's Cloud Platform.

Viewer Gallery
The platform supports a variety of viewer types, each designed for specific robotic operations. All viewers are added and configured directly from the Monitoring Tab.
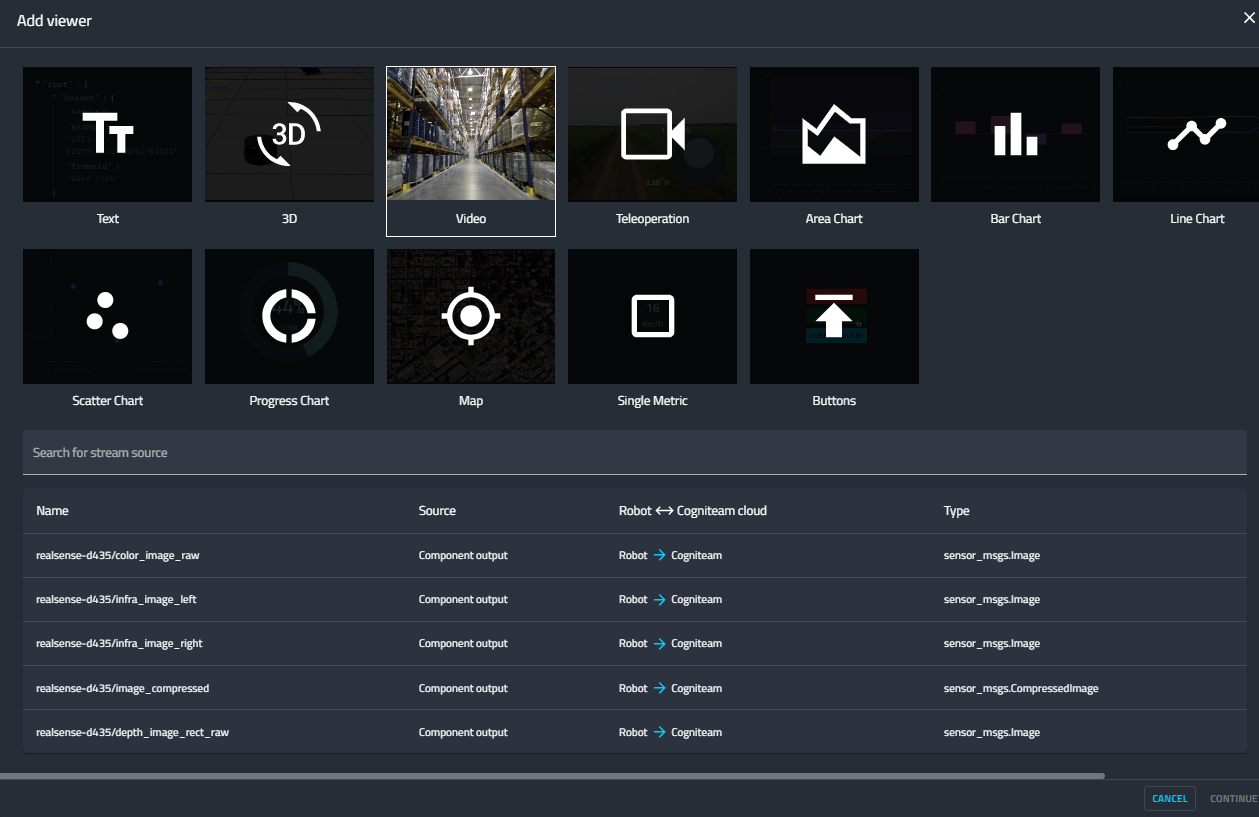
From the gallery you can add and configure:
- Text Viewer – Display raw messages and logs in a text panel.
- 3D Viewer – Visualize maps, LIDAR, point clouds, and markers in 3D.
- Video Viewer – Stream camera feeds for situational awareness.
- Teleoperation Viewer – Combine video with joystick-based remote control.
- Joystick Viewer – Inspect real-time joystick and operator command input.
- Data Charts Viewer – Plot metrics as charts (area, bar, line, scatter, progress).
- Map Viewer – Show the robot’s global position on a map.
- Single Metric Viewer – Highlight a single KPI with units and styling.
- Gauge Viewer – Present a value on a dial with min/max bounds.
- Buttons Viewer – Trigger predefined commands via configurable buttons.
- iFrame Viewer – Embed external or robot-served web content.
All Monitoring viewers also support draggable image overlays. Use overlays for alignment references, calibration marks, safety areas, or other visual guides that should sit above the live viewer content.
For detailed configuration and advanced options, see the dedicated pages for each viewer type.
Monitoring tab Presets and Layouts
Monitoring tab presets are used to create dashboards and control panels for your devices. You can create your own layouts and choose their visibility. They can be exported and imported between robots
- Upload or download monitoring presets from the page.
- When importing a confirmation appears if existing presets would be overridden.
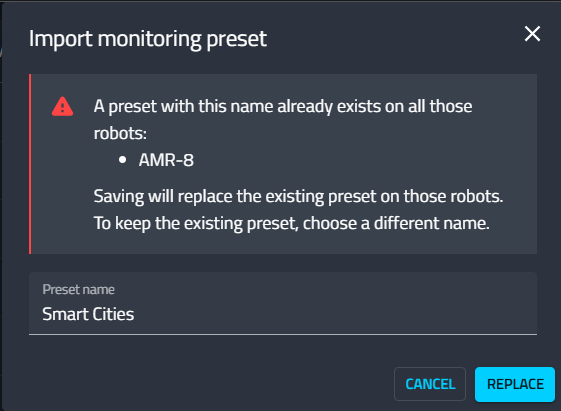
Monitoring tab presets can be used in the context of a single robot or in the context of a Fleet.
- Wnen importing fleet monitoring presets the Robot IDs in presets are preserved.
- When importing single-robot monitoring presets All IDs in the preset are replaced with the current robot ID.
- Invalid uploads produce a notification.
Local Monitoring Access
Access directly over LAN: https://<robot-ip>/monitoring.
Retrieve password: nimbus session local.
Enable editing locally: set LOCAL_EDIT_MODE true in nimbus.json.
Local access includes SSH and selected ROS settings exposure for quicker troubleshooting.
To embed Monitoring in another interface, add the hide-header query parameter to the Monitoring URL. This removes the Monitoring header while keeping the viewers and controls available inside the embedded page.
See also: Local access configuration in System Integration → Local Access & Monitoring. See also: Nimbus CLI reference for headless control and diagnostics.
Multi-Robot & Fleet Monitoring
- Fleet monitoring tab allows multiple robots' viewers in one layout.
- Multi-robot actions and layer differentiation in the 3D viewer make it easier to understand which robot each layer belongs to.
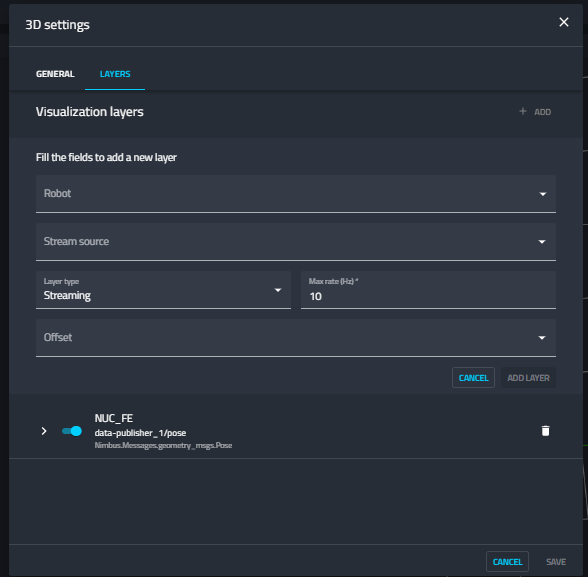
Recording & Streaming Stability
Improved buffering and a unified message rate mechanism reduce jitter and align WebRTC/gRPC stream cadence across viewers.