Data Charts Viewer
The Data Charts Viewer turns numeric data into visualizations so you can quickly understand trends, anomalies, and current values.
It supports multiple chart types:
- Area chart
- Bar chart
- Line chart
- Scatter plot
- Progress bar
This viewer is ideal for KPIs, analytics dashboards, and metrics exposed by components or the robot itself. Bar charts automatically reflect the latest value, support legends, custom bar labels and colors, and configurable Y-axis ranges.
Key Capabilities
- Multiple visualizations from a single data source.
- Configurable ranges for focusing on relevant value bands.
- Legend and label customization to keep complex dashboards readable.
- CSV support for visualizing historical or offline data.
Configuration
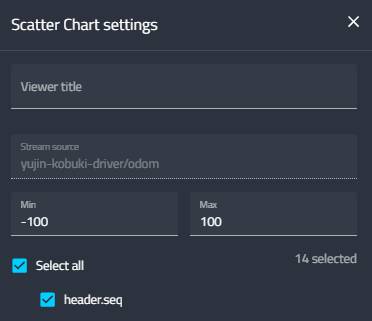
- Stream Source: Select the live data stream for the chart.
- Min/Max Values: Set display range limits (including bar chart Y-axis).
- Variables: Choose the data fields to plot.
- CSV Source: Use CSV from the robot or from the Resources page.