Point Cloud (3D Viewer)
The 3D Viewer is a powerful visualization tool that allows you to render and analyze spatial data in real time.
One of its primary use cases is visualizing LiDAR and depth-based point clouds, enabling operators to understand geometry, terrain, obstacles, and motion directly in 3D space.
This page focuses on configuring and using the 3D Viewer specifically for Point Cloud data.
Adding the 3D Viewer
To visualize point cloud data, you must first add a 3D Viewer to your preset.
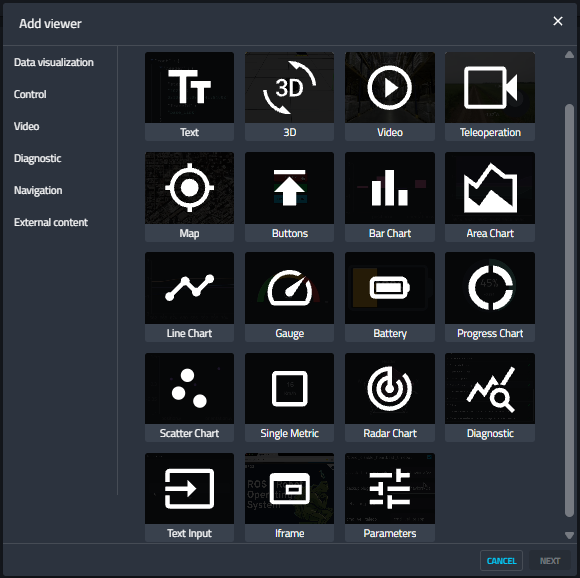
- Open the Add viewer dialog.
- Under Data visualization, select 3D.
- The viewer is added to the layout and is now ready for configuration.
Configuring a Point Cloud Layer
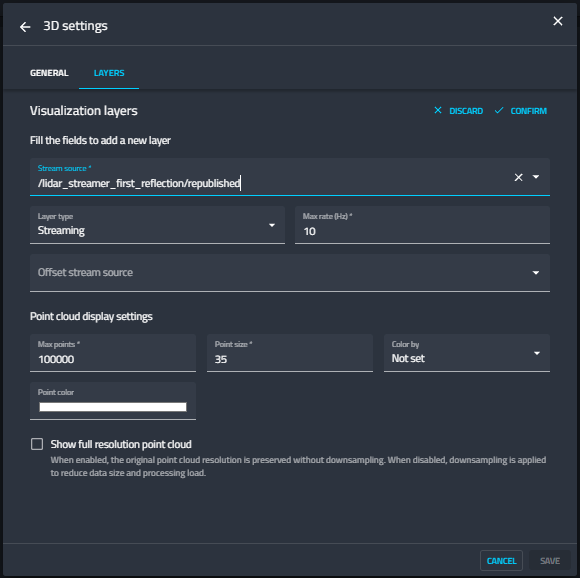
All point cloud configuration is done through 3D settings → Layers.
Each point cloud source is added as a separate layer, allowing you to control update rate, density, coloring, and performance independently.
Adding a Streaming Point Cloud
- Open 3D settings → Layers
- Click Add layer
- Configure the following fields:
-
Stream source
The ROS / backend topic publishingPointCloud2
Example: /lidar_streamer_first_reflection/republished -
Layer type
Select Streaming or Single -
Max rate (Hz)
Limits how often frames are rendered (for example,10 Hz)
Single Message vs Streaming Layers
The 3D Viewer supports two point cloud ingestion modes:
Streaming Layer
- Continuously updates at a controlled rate
- Best suited for live LiDAR feeds
- Update frequency is limited by Max rate (Hz)
Single Message Layer
- Fetches a full snapshot on demand
- Useful for static maps or large precomputed point clouds
- While waiting for the first message, a spinner is shown in edit mode
Point Cloud Display Settings
These settings directly affect visual clarity and rendering performance.
Density & Performance
-
Max points
Controls how many points are rendered after downsampling -
Higher values → more detail
-
Lower values → better performance
-
Show full resolution point cloud
When enabled, the original point cloud resolution is preserved (no downsampling).
Useful for detecting thin or sparse structures, but increases CPU and GPU load.
Readability
-
Point size
Controls the rendered size of each point -
Larger values (
25–35) improve visibility at distance -
Smaller values are better for dense point clouds
-
Color by
-
Not set – Flat color (recommended for general perception)
-
Distance – Heatmap or grayscale by range
-
Intensity – Useful for reflective surfaces and material differentiation
Viewer Environment & Orientation
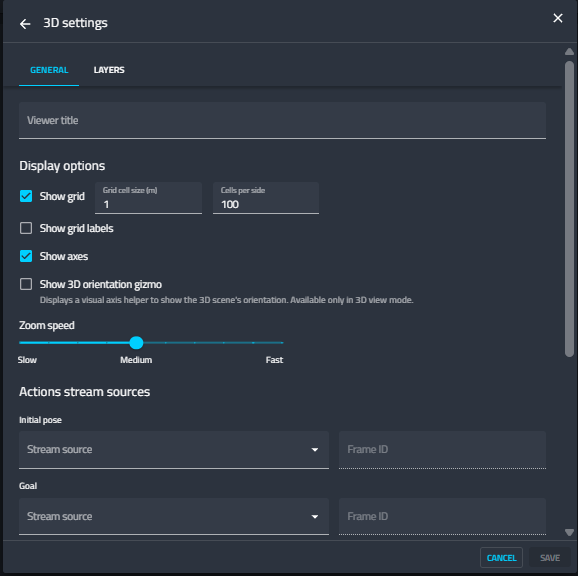
The General tab controls visual aids that help interpret scale and orientation.
-
Show grid
Displays a metric grid for distance estimation
Typical configuration: -
Grid cell size:
1 m -
Cells per side:
100 -
Show axes
Displays XYZ axes to verify correct coordinate alignment
These aids are especially important when debugging frame alignment or sensor mounting issues.
Distance Measurement
The 3D Viewer can measure distances in both 2D and 3D modes.
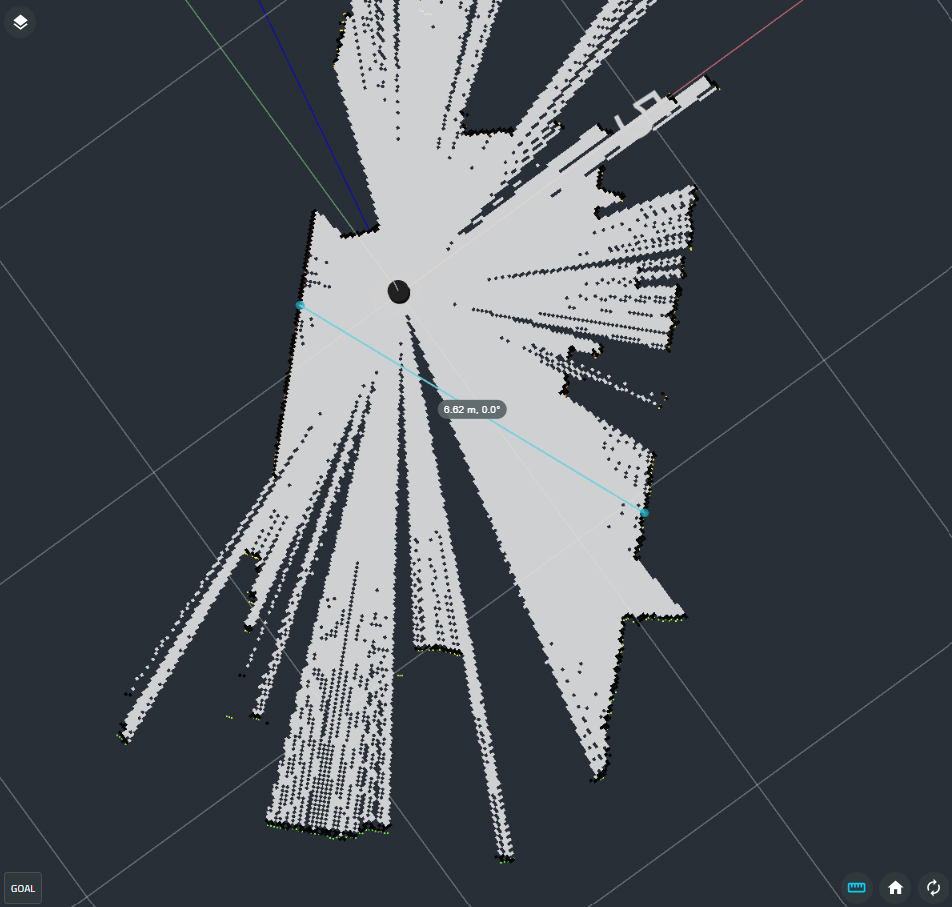
- Enable the measurement tool in the 3D Viewer controls.
- Select the first point on a plane or inside a point cloud.
- Move the cursor to preview the measurement. A dashed line follows the cursor and the live distance updates until the second point is selected.
- Select the second point to place the measurement.
Measurement is useful for validating clearance, checking map scale, or estimating the size of detected objects directly from Monitoring.
Point Selection
Point-cloud selection uses a consistent on-screen selection area regardless of distance from the camera. This makes distant scanned points easier to select without changing the apparent selection size.
Visualization Examples
Outdoor Terrain & Structures
Point clouds can capture large-scale outdoor environments including roads, vegetation, and buildings.
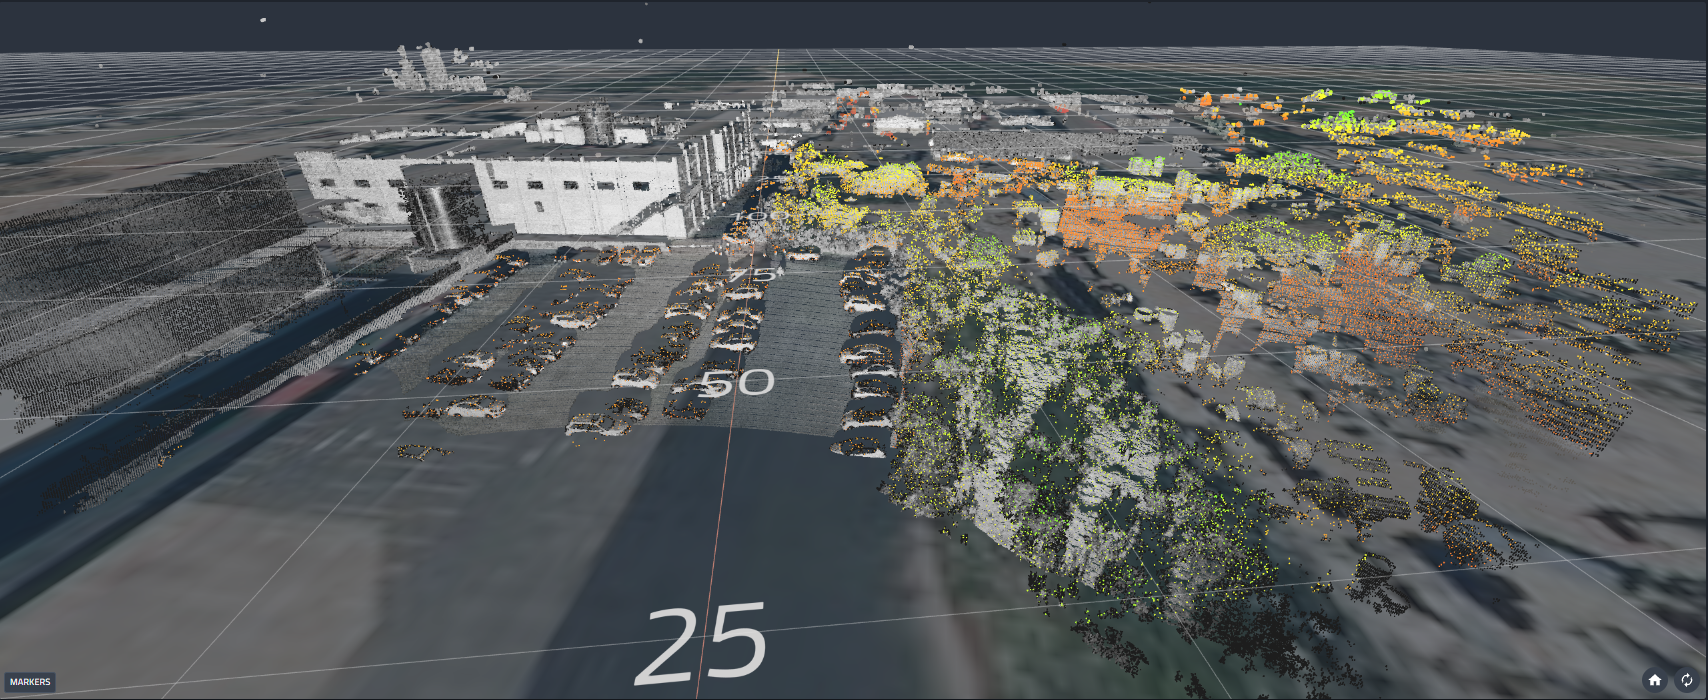
In this example:
- Height and coloring help distinguish layers of data
Point Cloud Over Map Data
The 3D Viewer can overlay point clouds on top of map or satellite layers, providing global context for local perception.
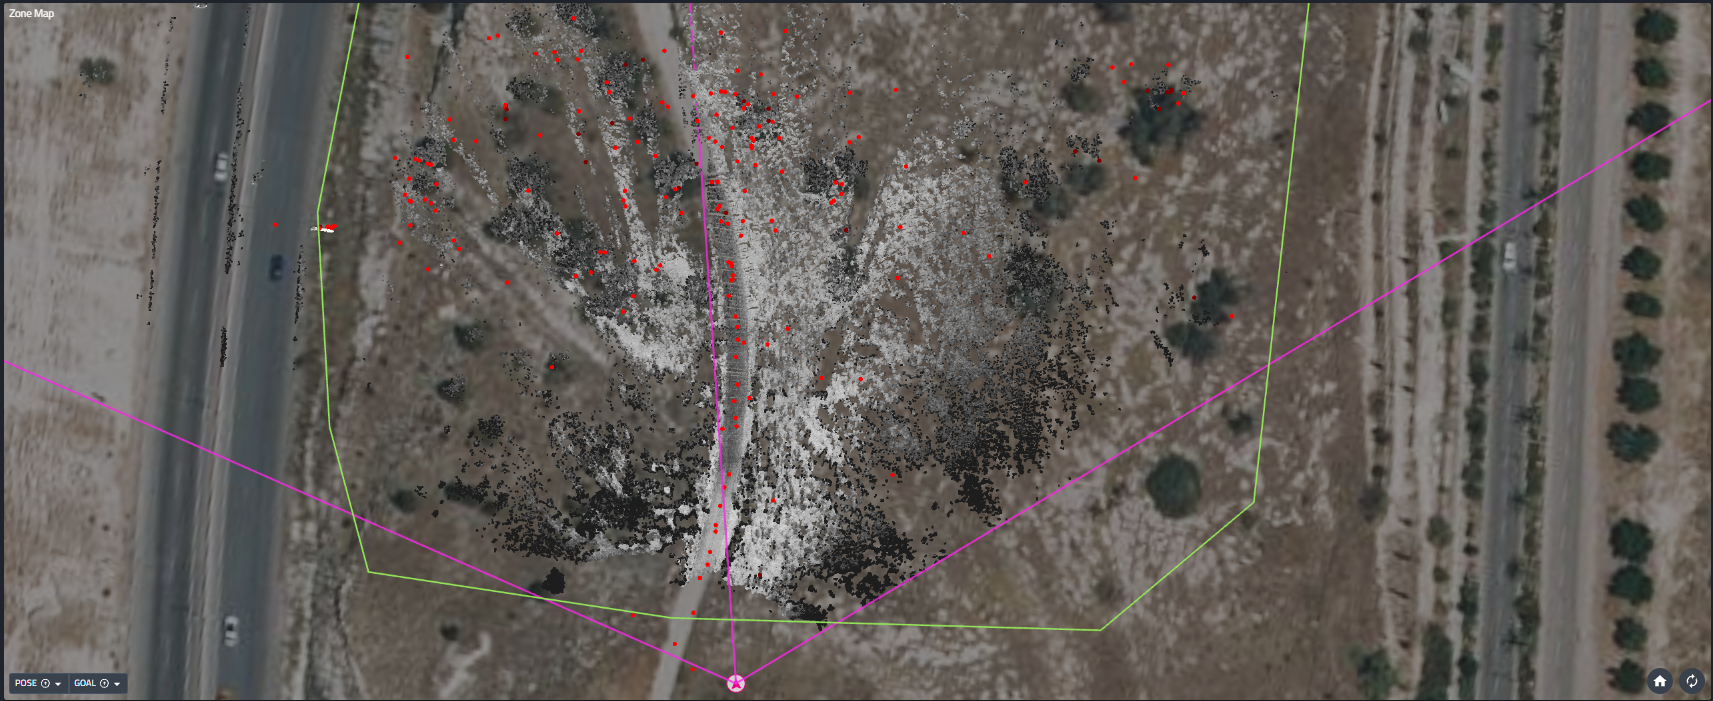
This view is useful for:
- Verifying localization accuracy
- Aligning LiDAR data with global maps or images
- Understanding large-scale scene layout (2D projects can be set when in edit mode)
Indoor Scans
Indoor environments benefit from high-density scans that reveal fine details.
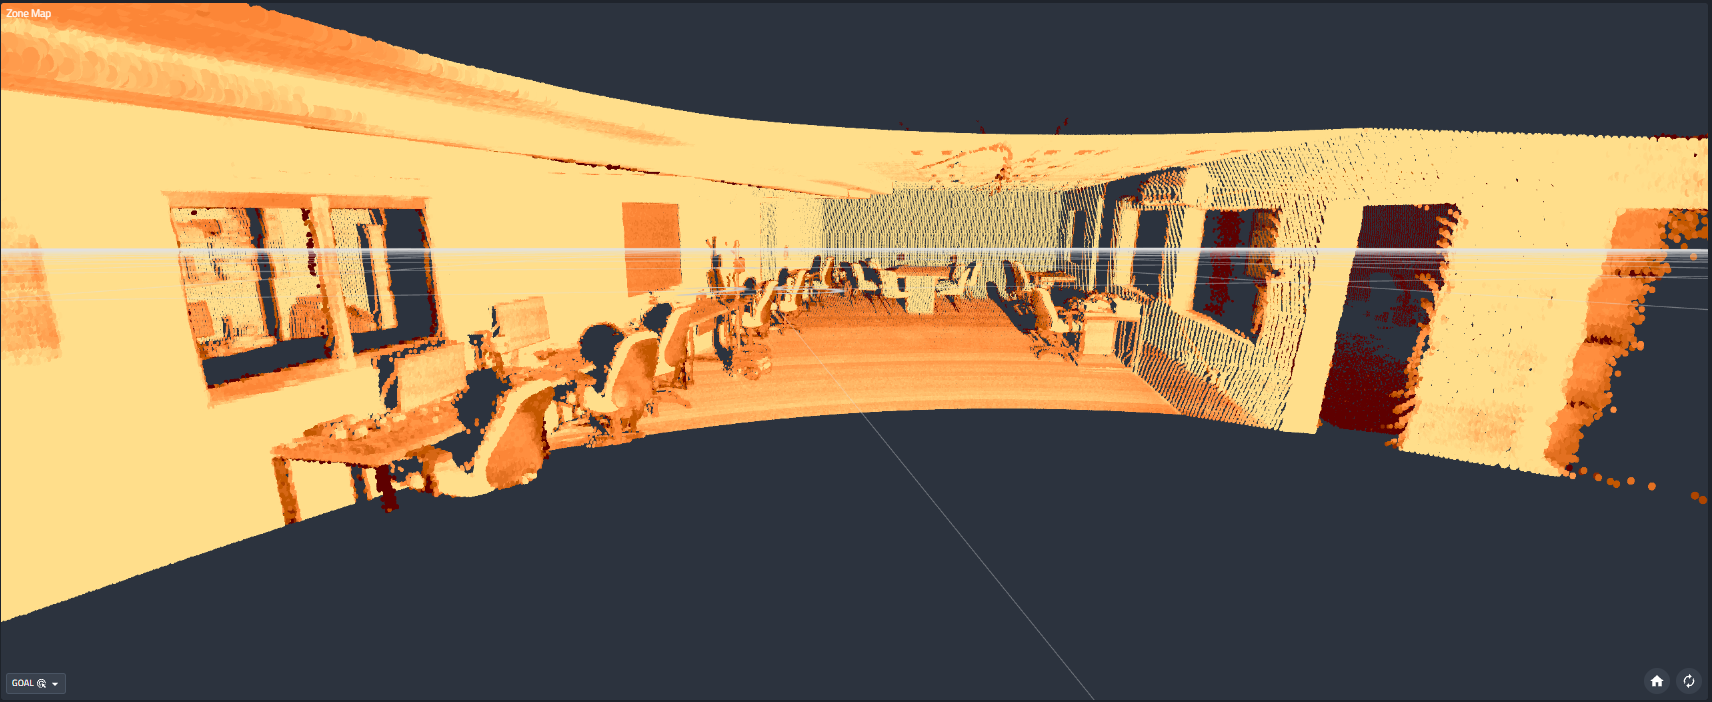
In this example:
- Intenisty data from Lidar is used to add colors
Best Practices
- Use Single Message layers for large static maps to reduce bandwidth usage
- Keep point size ≤ 20 for dense live LiDAR streams to maintain frame rate
- Prefer flat color or heatmap for spatial understanding
- Use intensity coloring for material differentiation
- Limit the number of simultaneous high-frequency layers
- Hide unused layers to improve responsiveness
Troubleshooting
| Symptom | Possible Cause | Resolution |
|---|---|---|
| Point cloud not visible | Wrong stream source | Verify topic path and publishing |
| Viewer is slow | Too many points or layers | Reduce max points or hide layers |
| Spinner never stops | No data published | Check that the source is active |
| Orientation looks wrong | Frame mismatch | Verify coordinate frames |
| Thin objects missing | Downsampling enabled | Enable full resolution mode |