Lidar Scan (3D Viewer)
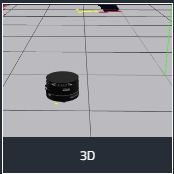
The Lidar Scan layer visualizes 2D LaserScan data directly in the 3D Viewer.
This is useful for debugging sensor coverage, alignment, occlusions, and detecting nearby obstacles in real time.
Scan Layer Settings
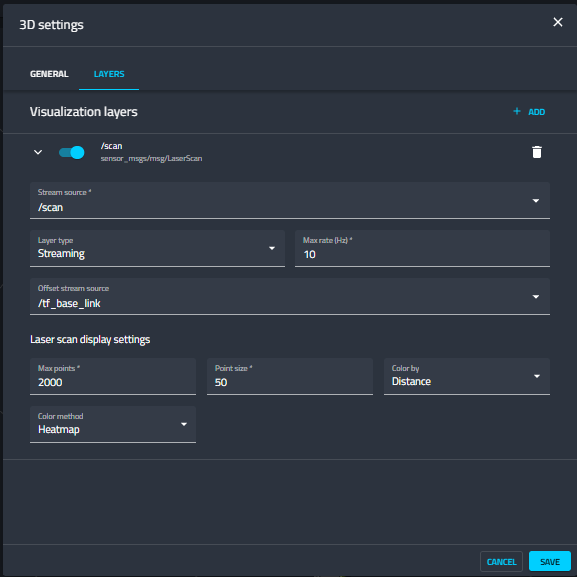
Each Scan layer is configured from the 3D Settings → Layers panel.
Data Source
- Stream source: ROS topic publishing
sensor_msgs/msg/LaserScan
Example: /scan - Layer type:
Streaming - Max rate (Hz): Limits the visualization update frequency
Example: 10 Hz - Offset transform source: Frame used for positioning the scan in 3D space
Example: /tf_base_link
This allows the scan to be correctly positioned and oriented relative to the robot or sensor frame.
Laser Scan Display Settings
These settings control how individual scan points are rendered:
- Max points
Maximum number of scan points rendered per frame
Example: 2000 - Point size
Visual size of each scan point in the viewer
Example: 50
Scan Layer Coloring
Scan points can be color-coded to improve depth perception and readability.
-
Color By
Distance– Colors points based on their range from the sensorIntensity– Uses laser return intensity (if available)Not Set– Renders points with a uniform color
-
Color Method
Heatmap(default) – Gradient coloring for better depth intuitionGrayscale– Monochrome scale when Distance or Intensity is selected
Coloring behavior is consistent between Scan and PointCloud layers, making it easier to correlate 2D and 3D data.
Visualization Example
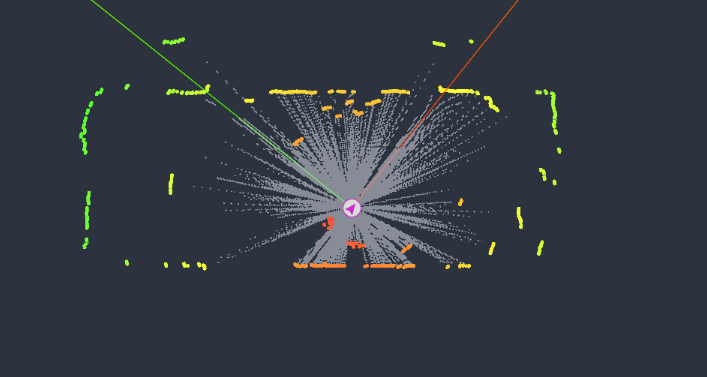
Below is an example of a 2D Lidar scan rendered in the 3D Viewer:
- Radial scan rays originating from the sensor
- Clear visibility of obstacles, edges, and open space
- Distance-based coloring highlighting nearby vs far objects
Notes & Best Practices
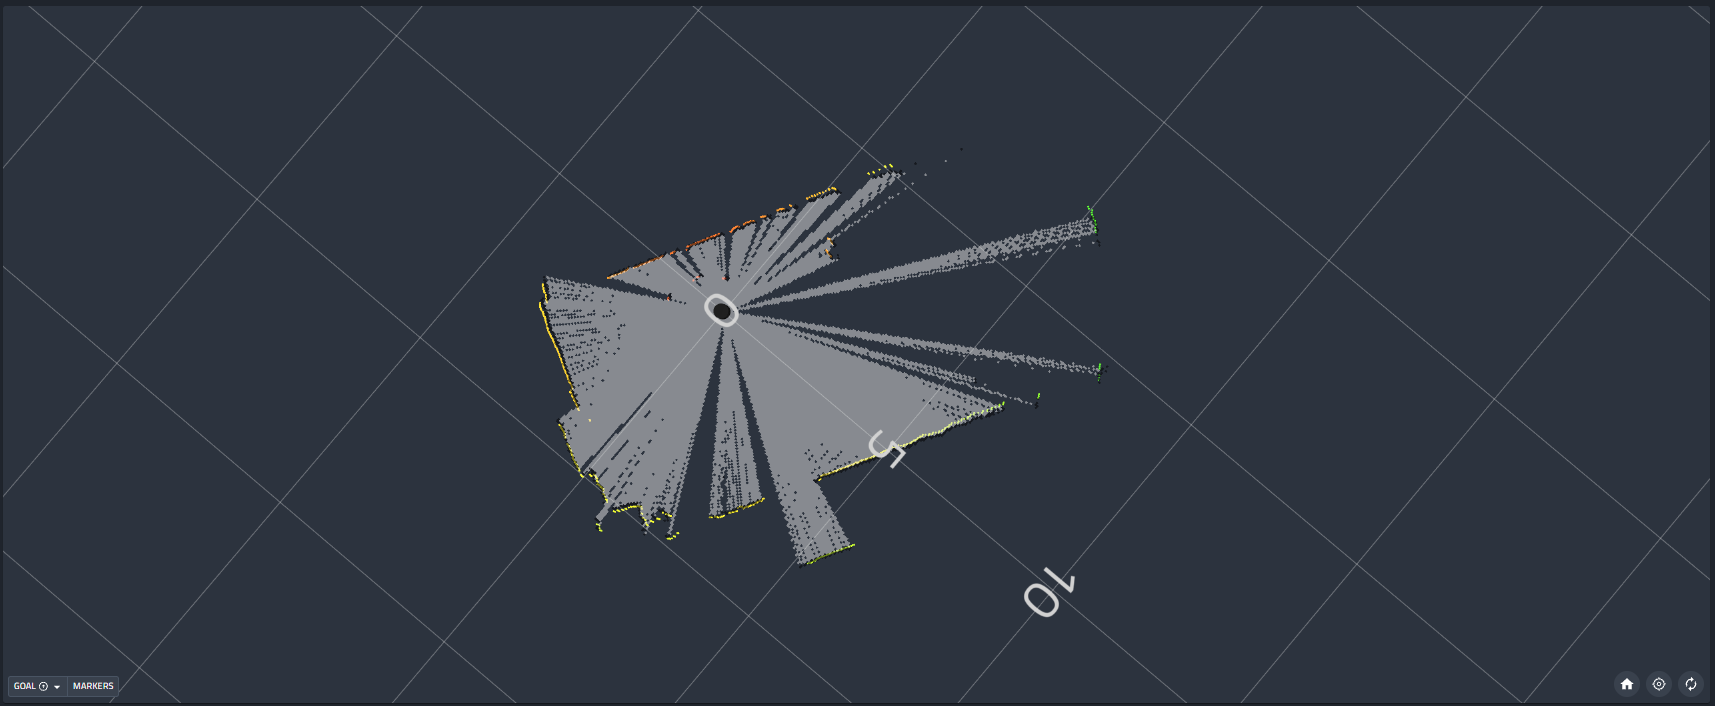
- Increase Point size for sparse scans or distant zoom levels
- Reduce Max rate if rendering multiple live layers to improve performance
- Use Distance + Heatmap for obstacle awareness and debugging sensor alignment
- Ensure the correct TF frame is selected to avoid rotated or offset scans